Data blends are useful in the case of data sources that have a limited relationship to each other and are used together for only some parts of the analysis and are kept separate for the remainder.
To blend a data source, follow these steps:
- Add a data object to the main area.
- Go to your visualization sheet.
- Click on the Data menu at the top of your screen, as shown in Figure 3.23.
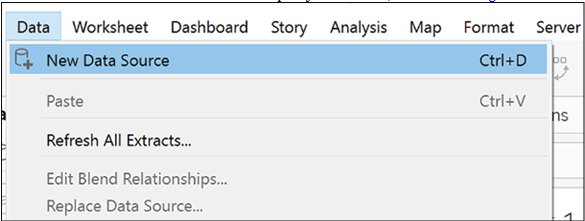
Figure 3.23: Accessing the Data menu in Tableau
- Click on New Data Source.
- Select the desired data source type and follow the prompts. For this example, we have chosen the Salesforce Superstore data, as shown in Figure 3.24:
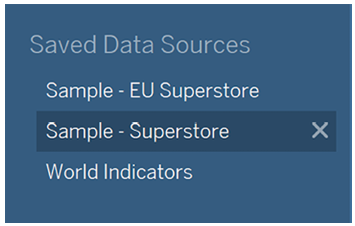
Figure 3.24: Adding a new data source in Tableau
- You will now see two different data sources in the top left corner of your data menu, as shown in Figure 3.25:
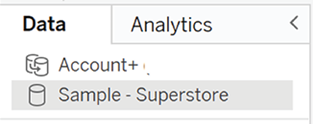
Figure 3.25: Two different data sources are visible after adding a new one
It is now time to define how the data sources should be blended. In order to do so:
- Click on the Data menu at the top of your screen.
- Click on Edit Blend Relationships. A menu will now open, as shown in Figure 3.26:
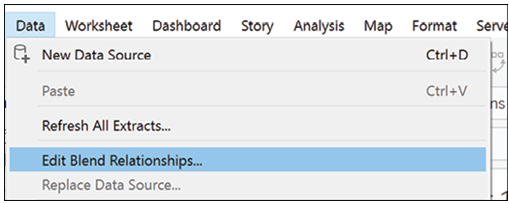
Figure 3.26: Editing blend relationships in Tableau
- In the menu, select which of your data sources should be the primary one. A good rule of thumb is the data source from which you will be taking the most fields, as shown in Figure 3.27:
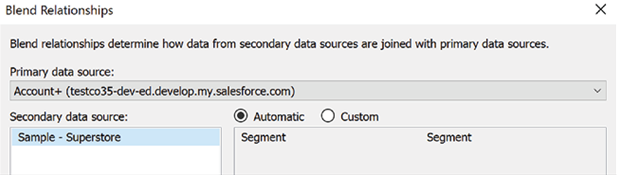
Figure 3.27: Selecting the primary data source for a blend in Tableau
- Below the primary data source selector, you will see a list of fields.
Tableau will try to populate those whenever possible. However, if these fields are incorrect or missing, you can adjust them by following these steps, as shown in Figure 3.28:
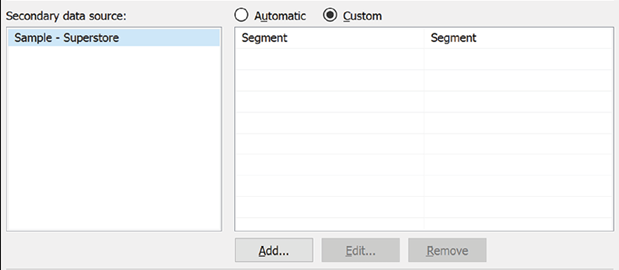
Figure 3.28: Defining relationships between fields in a Tableau data blend
- Select Custom from the Automatic/Custom selector.
- Click on a field (if present).
- Choose one of the options in the menu at the bottom:
• Add: To establish a relationship between two fields.
• Edit: To edit the relationship between two fields.
• Remove: To remove the relationship between two fields. - Clicking on any of these options will open a menu from where you can pick a field from the primary data source list and its counterpart in the secondary data source field
- In this case, we have added the Billing State/Province from Salesforce and matched it with State/Province in the Salesforce data. We have also kept the Segment to Segment match, as shown in Figure 3.29:
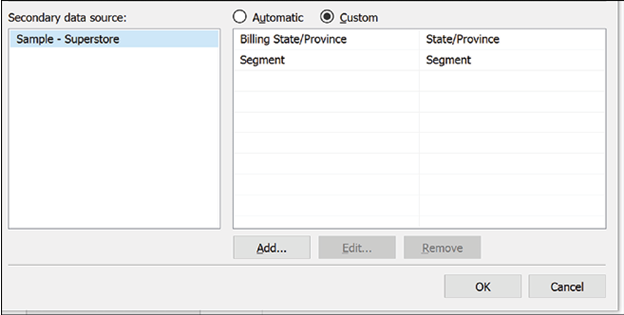
Figure 3.29: Mapping fields between two data sources to create a Tableau data blend
- Click on OK.
- If your blend is successful, you will notice the following changes:
• Your primary data source has a blue tick next to its name.
• Your secondary data source has an orange tick to its name, as shown in
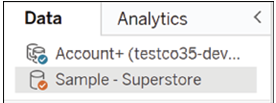
Figure 3.30: Indicators of a successful Tableau data blend
- The field(s) used for the blend have a chain icon next to their name.
You can turn the blend on and off by clicking the chain icon. Two linked chain rings indicate that the blend is currently active, and a barred chain icon indicates a currently inactive blend, as shown in Figure 3.31:
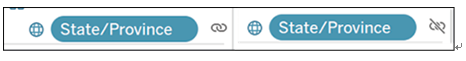
Figure 3.31: Chained versus barred chain icons indicating blend status
Troubleshooting tip
If you cannot see the changes, start dragging fields into the main visualization area. Tableau will treat the data source containing the first field you will use in the visualization as the primary one. For example, here, we have started by dragging the Industry field from the Salesforce data and only afterward added the Segment field from Superstore. So now you can see a blue tick next to Salesforce, as shown in Figure 3.32:
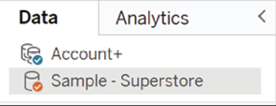
Figure 3.32: Tableau interpreting the first visualized field’s data source as primary in a blend
In this case, we started with the Superstore data and dragged Salesforce data afterward. The blue tick is now on the Superstore data, and the orange is on Salesforce, as shown in Figure 3.33:
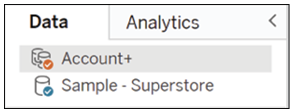
Figure 3.33: Tableau interpreting the first visualized field’s data source as primary in a blend1
Blends work regardless of the data source type, as you can see in this case, where the Salesforce data is being blended with the standard Tableau Superstore data, which comes as an Excel .xls file. They are a good solution when dealing with different data types, as in this case, but can quickly encounter performance issues.