Using extensions in Tableau – Dealing with Complex Visualizations, Customizations, and APIs

It is also possible to use third party services to create visualizations in Tableau. Tableau Exchange (https://exchange.tableau.com/extensions) provides an array of objects that can be used in a Tableau dashboard to create charts but also perform spatial analysis, add custom annotations to charts, and even collaborate in Teams.

Salesforce has its own set of extensions, and there is also a set of extensions developed directly by Tableau.

To access them, follow the below-mentioned steps:

  1. Create a new dashboard by pressing the New Dashboard button at the bottom of your screen, as seen in Figure 6.71:

Figure 6.71: New dashboard

2. Next, drag the Extension object on your dashboard.
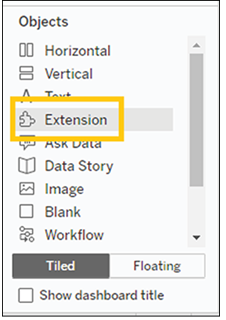
Figure 6.72: Add Extension

3. The interface which opens will show all the Extensions available on Tableau Exchange without needing to leave Tableau.

Each extension has its own set of instructions, and in Chapter 9 – Exploring Einstein AI and Advanced Analytics, we will show you how to use the Salesforce Einstein extension, but in the meantime, explore the available range to find the extension that mostly fits your needs. And if you cannot find the perfect one, you are now well-equipped to create every sort of visualization in Tableau.

Conclusion

In conclusion, as we wrap up this insightful journey into the realm of advanced visualizations using Tableau and Salesforce CRM data, it is our hope that you have gained a deeper understanding of the vast capabilities that this visualization tool offers. The power to transform raw, often complex CRM data into meaningful and insightful visual representations lies at your fingertips.

Through this chapter, we aimed to elevate your skills from creating sophisticated Sankey diagrams and calendar-based visualizations to expertly customizing geographical data visualizations. We also discussed the power of third-party integrations, a crucial aspect in today’s interconnected technological landscape. The potential for innovation here is vast, and we encourage you to explore further, continually pushing boundaries to uncover deeper insights from your CRM data.

Remember, fostering a data-curious culture within your organization is a journey, not a destination. Every dataset brings new questions, unique insights, and innovative perspectives. The beauty of data visualization is that it brings us closer to the story hidden within the data, enabling data-driven decision-making crucial for business growth.

We will now move back into Salesforce to look at using Tableau Visualizations within the CRM.

Join our book’s Discord space

Join the book’s Discord Workspace for Latest updates, Offers, Tech happenings around the world, New Release and Sessions with the Authors:
https://discord.bpbonline.com

Advanced maps – Dealing with Complex Visualizations, Customizations, and APIs-3

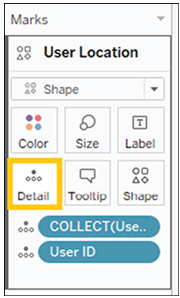
  1. At this point, your points will disappear to be replaced by a single circle. To fix this, drop the User ID onto Detail in the User Location Mark card, as can be seen in Figure 6.60:

Figure 6.60: Add detail

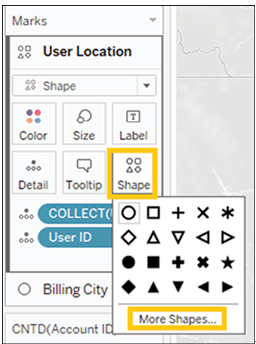
  1. All of your circles are now back. But you may want to choose a more evocative shape. Click on Shape to open a menu, then click on More Shapes, as shown in Figure 6.61:

Figure 6.61: Open shape menu

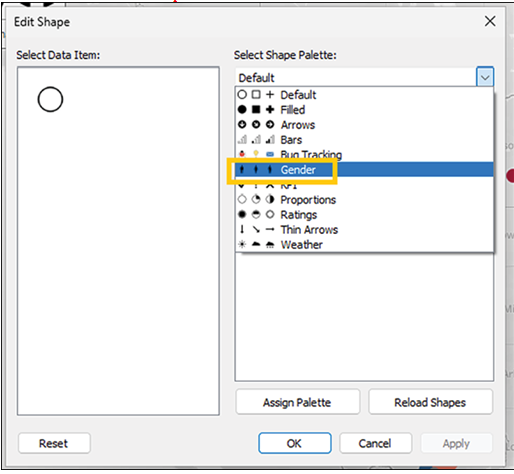
  1. From the Select Shape Palette menu, click on Gender.

Figure 6.62: Select Gender shapes

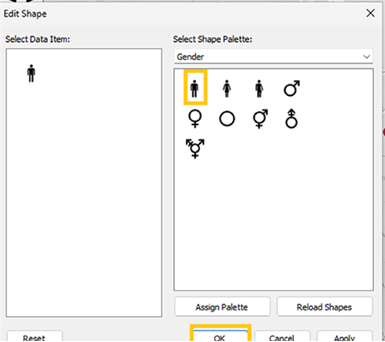
  1. Click on one of the icon (in this case the first icon has been selected), then press OK, as shown in Figure 6.63:

Figure 6.63: Select first gender icon
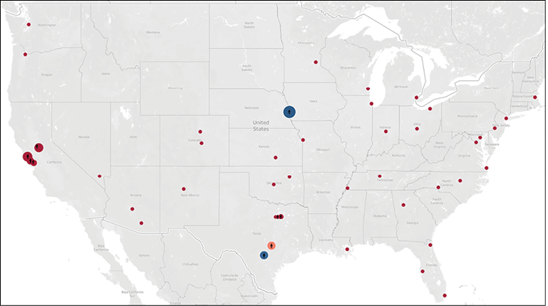
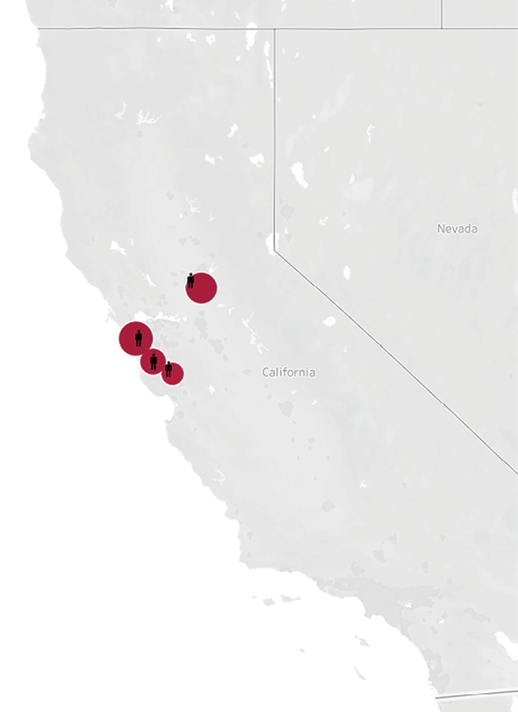
Our map (Figure 6.64) now has little human figures showing where our sales representatives are present.

Figure 6.64: Figures for salespeople
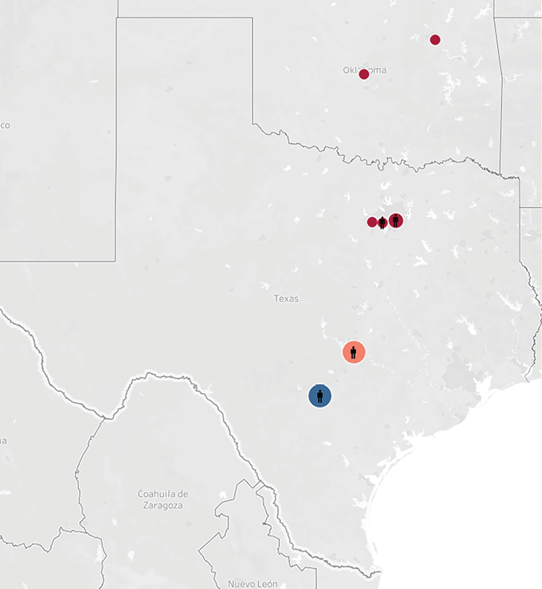
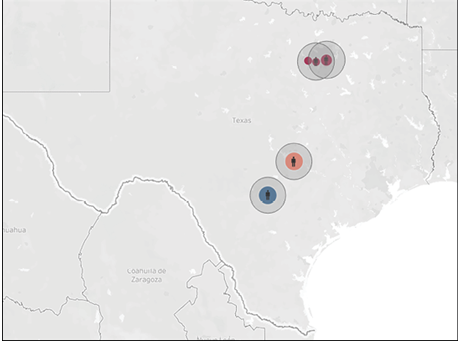
Once we zoom into some of our states, the reasons for what we see in the data seem clearer. Take Texas, for example, as shown in Figure 6.65:

Figure 6.65: Texas
We have four sales representatives, two of which are reasonably far from each other and, although the performance of one of them is much worse than the other, it is still not as bad as the performance of the accounts where the sales representatives are close to each other. Looking at California (Figure 6.66) reveals a similar pattern.

Figure 6.66: California
Again, we see poor performance and sales representatives close to each other. We can show the extent of the problem in a more dramatic way by using the buffer function, which creates a radius around a specified point. In our case, this radius could act as the area we would expect a sales representative to cover.
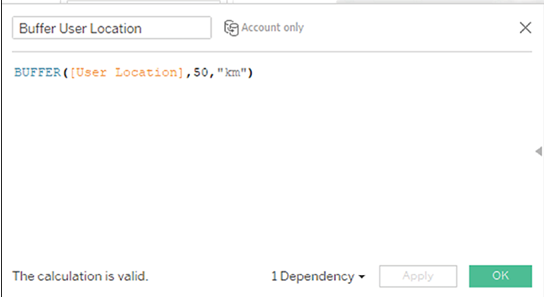
In order to do so, create a new calculated field and use the following formula, as shown in Figure 6.67:

Figure 6.67: User location buffer calculation
In this case, we are asking Tableau to draw an area around each sales representative with a radius of 50 km.
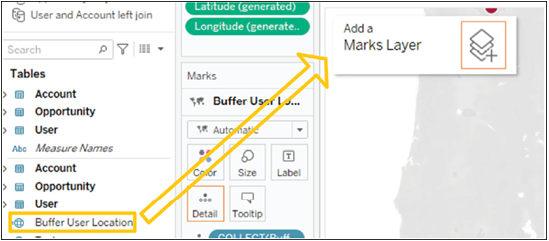
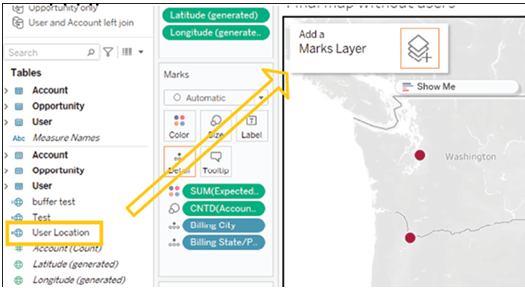
Just as before, take the calculated field you have just created and drag it to the map on the Add a Marks Layer icon, as can be seen in Figure 6.68:

Figure 6.68: Add buffer layer
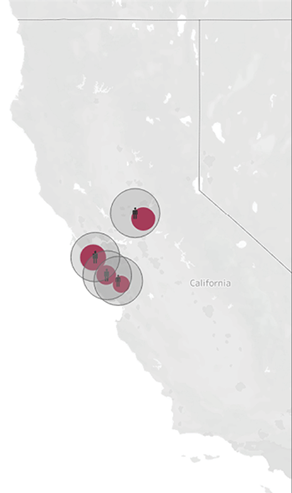
We can now see the extent of our problem more clearly. Let us start with California. All three sales areas overlap (Figure 6.69), which tells us that our sales representatives are pursuing the same accounts, which is possibly leading to frustration in our customers.

Figure 6.69: Buffer layer
Similarly, in Texas, where the sales representatives’ areas overlap, we see poor performance in sales.

Figure 6.70: Salespeople with buffer
This example shows the power of spatial analysis for cases in which geography plays a significant role in the data. While a combination of other charts may have led us to the same result, none would achieve the same immediacy as the map we just built together.

Advanced maps – Dealing with Complex Visualizations, Customizations, and APIs-2

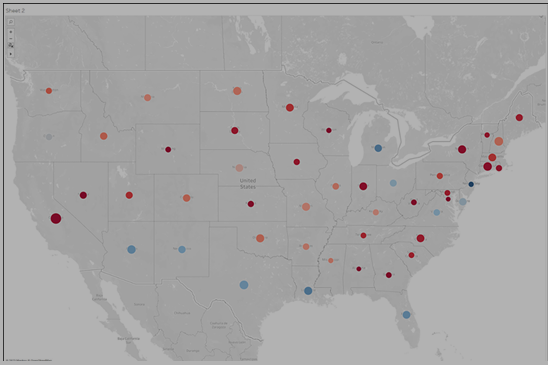
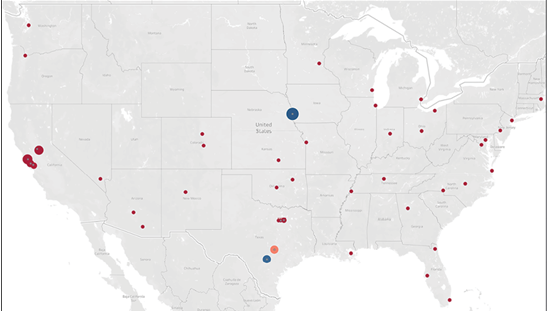
In one map, we can now see in which states we have the most accounts and the largest revenue. An even more interesting pattern emerges in which the number of accounts and the revenues do not go hand in hand. Rather, we can see even more clearly the clusters where we would expect large revenues (that is California) but are instead seeing poor performances. All of these clusters are close together, so there must be a geographical explanation of what we are seeing (Figure 6.55).

Figure 6.55: Colored dots
To proceed with the next step, we need to create a new dataset that joins the objects Accounts, Opportunities, and Users. This will allow us to bring together the geographical information related to the accounts, the financial information tied to opportunities, and the geographical locations pertaining to our sales representatives, which can be found in the User object. Alternatively, you can use the dataset provided in this book.
Since 2019, Tableau has allowed the option to perform spatial analysis even in cases where spatial files are unavailable, as long as information such as latitude and longitude is provided. Luckily, Salesforce provides this information out of the box for both Accounts and Users.
Let us go back to our original map and work from the assumption that since we have spotted a geographical pattern in our data, geography could also present a solution, in this case, by looking at where our sales representatives are located against our accounts and the revenue we expect to generate.
In the previous case, we have built a map at the state level. Now, we will go down to the city level. The process is the same as described before, but this time, we will start with the Billing City field rather than the Billing State. The final result should look something like the map below:

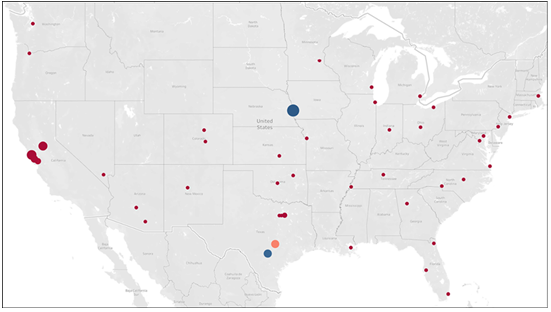
Figure 6.56: Sized dots
When we break our data down by cities, the contrast is even starker. We see that California has several accounts but low expected revenues, while revenues in Texas seem to be driven by a specific city. At the border between Nebraska and Iowa, we have our most profitable accounts. How does this compare with the geographical location of our sales representatives?
To answer this question, we will start by creating a spatial object out of the latitude and longitude of our User object. To do so, follow the below-mentioned steps:
  1. Create a calculated field and write the following formula:
  2. Give a name to your calculation, then press OK.
  3. Drag the field you have just created to the map and then on top of the Add a Marks Layer icon on your map, as shown below.

Figure 6.57: Add user locations layer
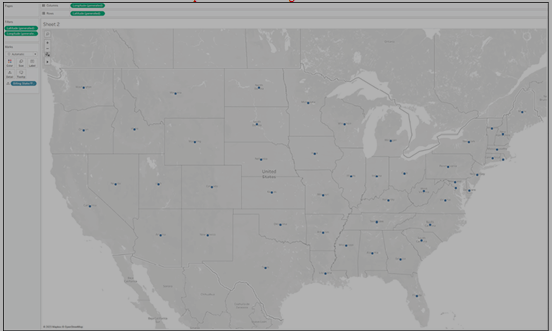
You will notice now that there is an additional dop on top of each account; this is the location of each sales representative (Figure 6.58).

Figure 6.58: Users Layer

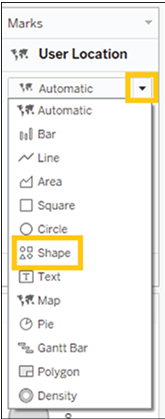
  1. As usual, we can improve upon this. First, change the kind of mark for the User Location field from Automatic to Shape, as shown in Figure 6.59:

Figure 6.59: Change mark type to shape

Advanced maps – Dealing with Complex Visualizations, Customizations, and APIs-1

We can convey several layers of information by using maps in Tableau. We started in the previous chapter with a simple filled map, and we will now take it one step forward by looking at the number of accounts and the revenues on the same map.
Before we do so, you will have to upload some additional data to your org that is required for this visualization. First, download the files available at the GitHub repository for the book.
Now follow these instructions to load the opportunities:

  1. Login to Salesforce and navigate to the ‘Setup’ area by clicking the gear icon in the upper right corner.
  2. In the Quick Find box, type and select Data Import Wizard.
  3. Click on the Launch Wizard button within the Data Import Wizard.
  4. Select the type of object that matches your CSV data, such as Opportunities for opportunity data.
  5. Click on Choose a CSV file, browse to your tfs_opps.csv file, and upload it.
  6. Review the field mappings. The wizard will try to auto-map CSV columns to Salesforce fields. Adjust manually if necessary.
  7. After verifying the field mappings, click Next.
  8. Review your import settings in the summary page and click Start Import.
  9. Monitor the import progress. Salesforce will indicate when the import is complete.
  10. Once the import is complete, check the relevant object in Salesforce, like Opportunities, to ensure the data is correctly imported.
  11. Review any error reports generated by Salesforce and address any issues highlighted.

Repeat this process for the tfs_accs.csv file, the Account object, the tfs_users.csv file, and the Users object.
For this chart, the Account object was used as a primary data source, and the Opportunity object as a secondary data source. Please refer to Chapter 3, Building and Integrating Data Pipelines for details on how to blend data sources.
To create our map, follow these steps:

  1. Double-click on the Billing State/Province field (from the Accounts object). This will create a map, as shown in Figure 6.49:

Figure 6.49: Add Billing State to view

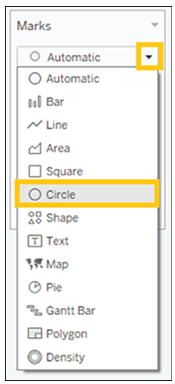
  1. From the Marks menu, change the mark type to Circle, as shown in Figure 6.50:

Figure 6.50: Change mark type to circle

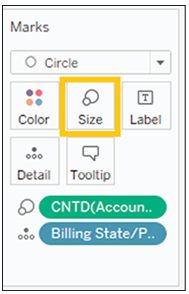
  1. Right-click on Account ID and drag it onto the Size card, choose Count Distinct from the menu that opens, as shown in Figure 6.51:

Figure 6.51: Size by Account count

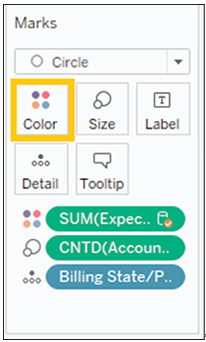
  1. From the Opportunity object drag Expected Amount to Color (make sure to have set the blend correctly), as shown in Figure 6.52:

Figure 6.52: Color by Expected Revenue

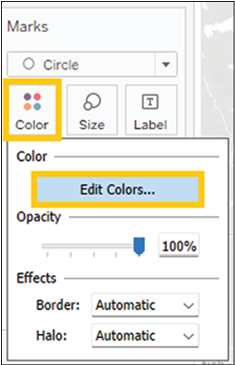
  1. Click on the Color card, then choose Edit Colors, as can be seen in Figure 6.53:

Figure 6.53: Edit colors

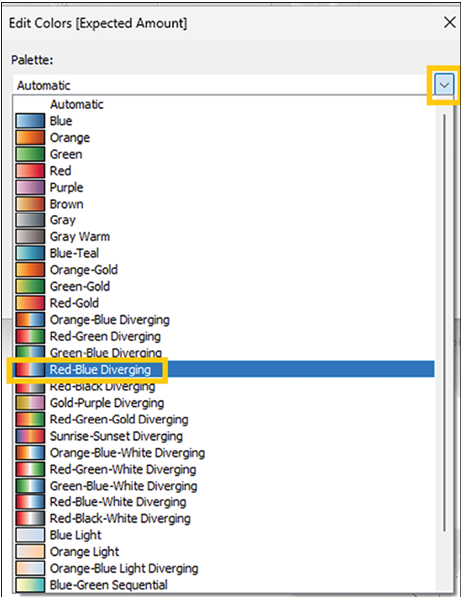
  1. Choose the Red – Blue Diverging palette, as shown in Figure 6.54:

Figure 6.54: Change color palette

Funnel charts– Dealing with Complex Visualizations, Customizations, and APIs

One of the most indicative charts for Salesforce data is the funnel chart, which is the chart in which we can follow the progression of our sales pipeline from initial contact to final conclusion.
For this chart, we will use the custom dataset Opportunity History that comes with this book. If you are working with real Salesforce data, you should be able to replicate this chart using the Opportunity History object from your Salesforce environment or your data warehouse, following the instructions in Chapter 3 – Building and Integrating Data Pipelines.
To create a funnel chart, follow these steps:

  1. Filter out “Closed Lost” by using Stage Name as a filter and excluding “Closed Lost”.
  2. Drag Stage Name onto Rows, as shown in the following figure:

Figure 6.24: Drag Stage Name to Rows

  1. Right-click on Opportunity ID and drag it to Columns. In the menu that opens, choose Count Distinct (Figure 6.25).

Figure 6.25: Count distinct Opportunities by Stage

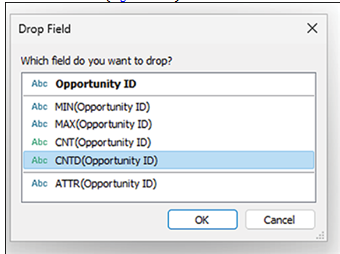
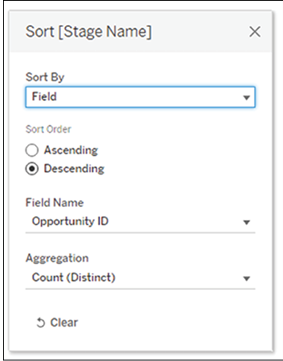
  1. Sort Stage Names in descending order according to the number of opportunities.

Figure 6.26: Sort Stages by count descending
We now need to trick Tableau into creating our funnel chart. To do so:

  1. Right-click on Opportunity ID, drag it to Columns, and drop it next to the green pill you already have there, as shown in Figure 6.27:

Figure 6.27: Copy Opportunity Id to Columns
You should now have two identical bar charts which look like the chart below:

Figure 6.28: Two identical bar charts

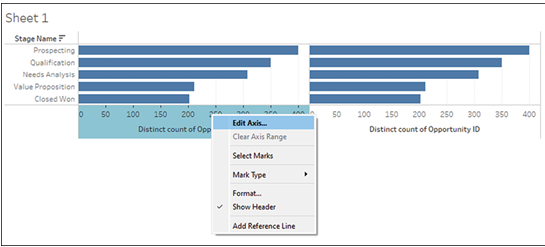
  1. Right-click on the left axis and click Edit Axis from the menu that opens, as shown below:

Figure 6.29: Copy Opportunity Id to Columns

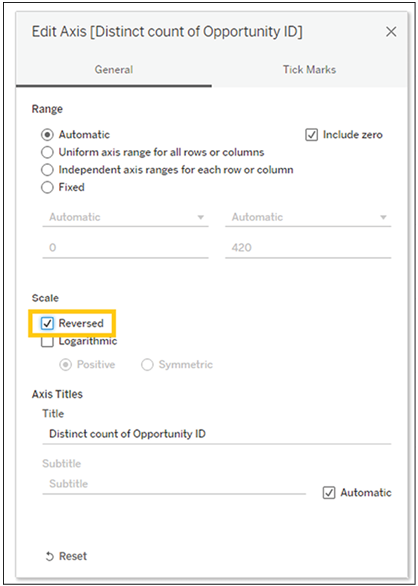
  1. Select Reversed, as shown in Figure 6.30:

Figure 6.30: Reverse left axis
Your chart should now look like the one below, already much more like a funnel.

Figure 6.31: Funnel

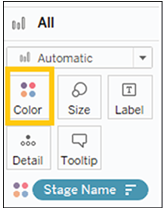
  1. Drag Stage Name to the Color mark in the All card, as shown in Figure 6.32:

Figure 6.32: Color Stages

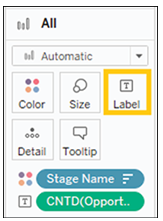
  1. Press Ctrl on your keyboard and drag the CNTD (Opportunity ID) field to the Label mark in the All card, as shown in Figure 6.33:

Figure 6.33: Add label

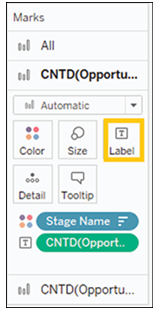
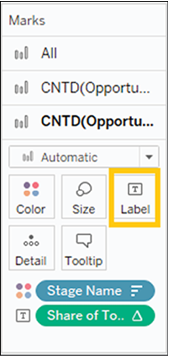
  1. Click on the Label mark on the top CNTD (Opportunity ID) card, as shown in Figure 6.34:

Figure 6.34: Select label

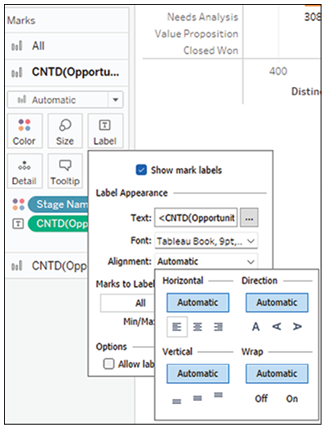
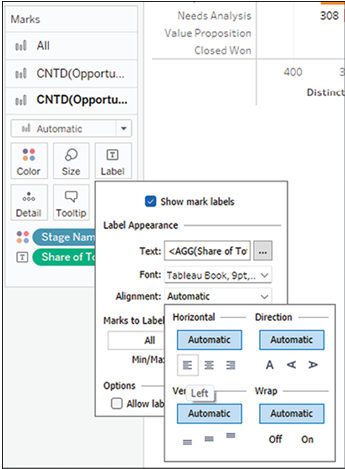
  1. In the Alignment menu, choose left, as shown in Figure 6.35:

Figure 6.35: Align labels left
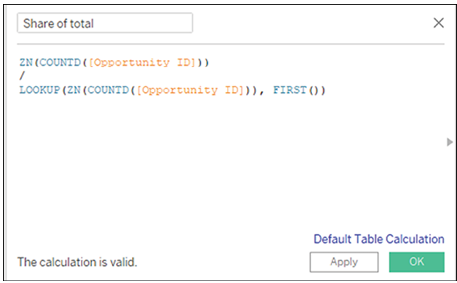
A funnel would not be a proper funnel without percentages, so we will create a new calculated field and paste the following formula:
This formula divides the number of opportunities at each stage by the number of opportunities in the first stage, thus giving us a view of the percentage of opportunities that continue to the next stage of our sales pipeline.

  1. Give your calculated field a name. The one below, for example, is called “Share of total”.

Figure 6.36: Share of total calculation

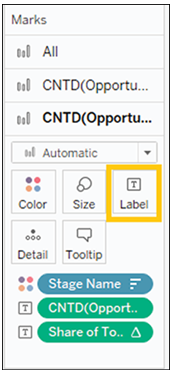
  1. Drag your new calculation onto the Label mark in the bottom CNTD (Opportunity ID) card, as can be seen in Figure 6.37:

Figure 6.37: Add calculation to label

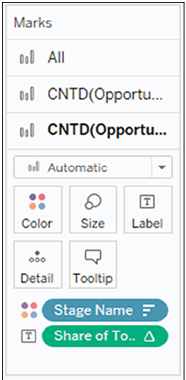
  1. Drag CNTD (Opportunity ID) away to remove it from the chart, as can be seen in Figure 6.38:

Figure 6.38: Remove count

  1. Click on the Label mark on the bottom CNTD (Opportunity ID) mark, as shown in Figure 6.39:

Figure 6.39: Select bottom label

  1. In the Alignment menu, choose left, as shown in Figure 6.40:

Figure 6.40: Align bottom labels left

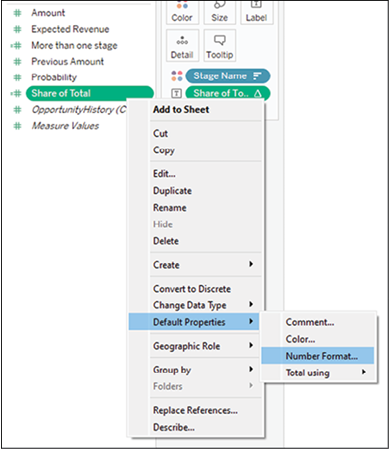
  1. Right click on the calculation you have created and select Default Properties from the menu that opens, next click on Number Format.

Figure 6.41: Open number formatting

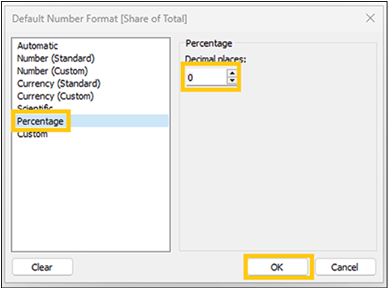
  1. In the pane that opens, select percentage, decrease the decimal places to 0, and click on OK, as shown in Figure 6.42:

Figure 6.42: Set percentage format
We are almost there, but we need some cosmetic adjustments for this chart to look like a funnel, follow the below steps to do so:

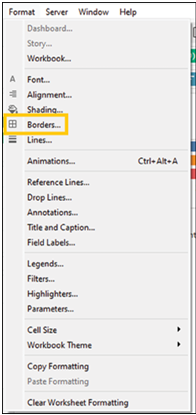
  1. From the Format menu, click on Borders, as can be seen in Figure 6.43:

Figure 6.43: Open Borders menu

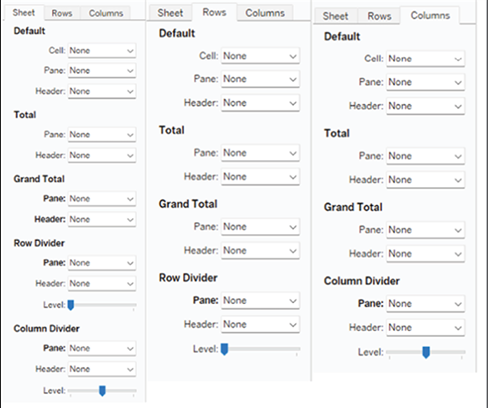
  1. Select None from each menu in Sheet, Rows and Columns (if it does not say so already), as can be seen in Figure 6.44:

Figure 6.44: Select no borders

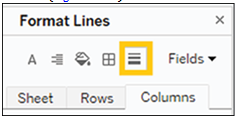
  1. Click on the Lines icon (Figure 6.45).

Figure 6.45: Open Lines menu

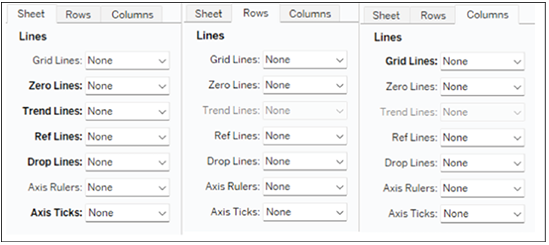
  1. Select None from each menu in Sheet, Rows and Columns (if it does not say so already), as shown in the figure below:

Figure 6.46: Select no lines

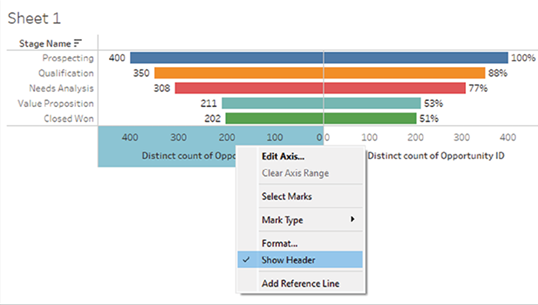
  1. Right click on the left axis and untick “Show Header”, as shown in Figure 6.47:

Figure 6.47: Hide left axis header
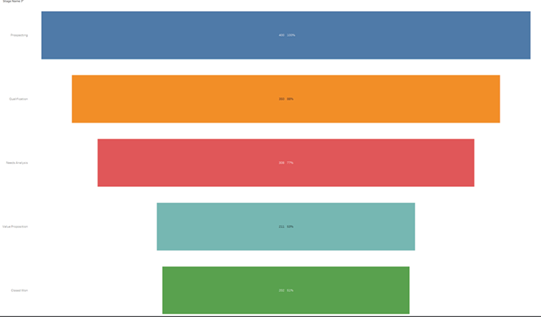
Your chart should look something like the one below:

Figure 6.48: Funnel final

Pareto charts– Dealing with Complex Visualizations, Customizations, and APIs-2

You now have your chart with your reference line, but we can make it a bit clearer. Follow these steps:

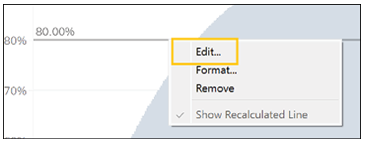
  1. Right click on the Reference line you just created and click on Edit, as seen in Figure 6.14:

Figure 6.14: Right click the reference line

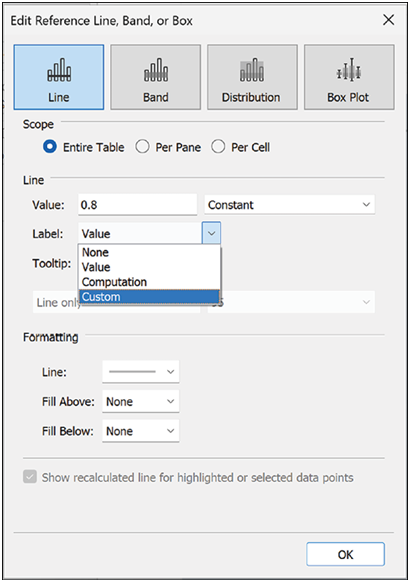
  1. In the window that opens, choose Custom from the Label menu, as can be seen below:

Figure 6.15: Set custom label

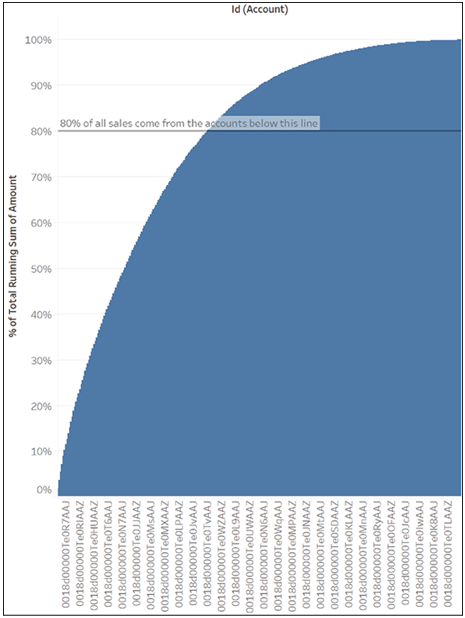
  1. Write something that helps users understand what the line represents, for example, “80% of all sales come from the accounts below this line”, as shown below:

Figure 6.16: Reference line label

  1. Click on OK.
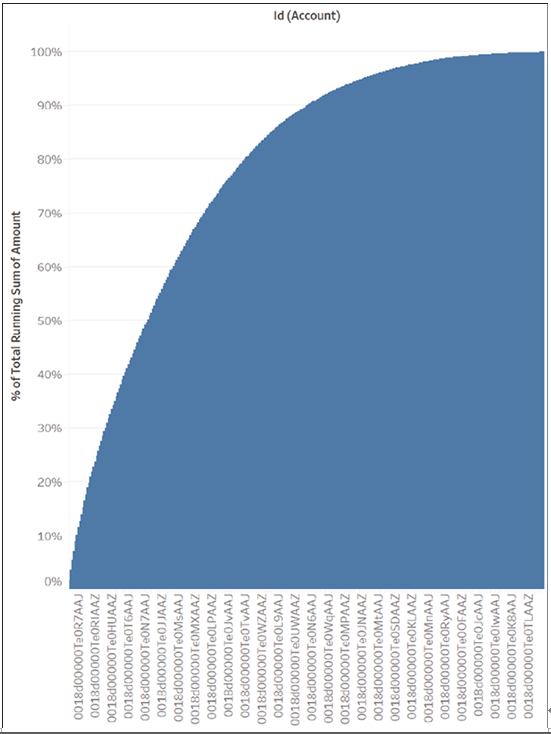
    We can see that the 80/20 rule does not apply to our case (Figure 6.17), but we cannot yet see clearly where that line is; it seems to be somewhere between 30 and 40%, but is that the case? We can find out exactly and, at the same time, improve our Tableau skills.

Figure 6.17: Copy Id field
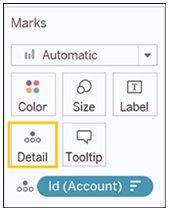
For this next stage, press CTRL on your keyboard and drag the ID field from Columns to the Detail mark, as seen in Figure 6.18. This should copy not only the field but also the sorting we set up earlier.

Figure 6.18: Id field copied
From here, follow these steps:

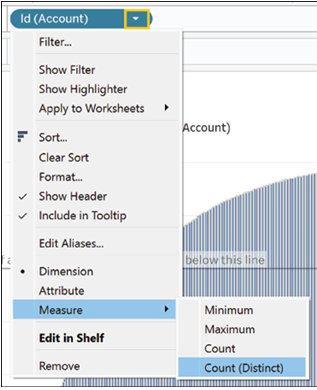
  1. Click on the caret on the Id pill, hover on Measure, then select Count (distinct), as seen in Figure 6.19:

Figure 6.19: Change Id measure to Count (distinct)

  1. Do not panic if your chart looks broken now; we are about to fix it. Click on the now green ID pill and apply the same table calculation we applied on the SUM (Amount) pill, with the same options, as shown below:

Figure 6.20: Apply table calculations to copied Id field

  1. You now have a Pareto chart, which tells you that 37% of your accounts drive 80% of your revenues (Figure 6.21).

Figure 6.21: First reference line at 80%
Some other insights are:
• Adding a second reference line at 50% tells us that it is 17% of our accounts that drive half of our sales, as shown in Figure 6.22:

Figure 6.22: Second reference line at 50%
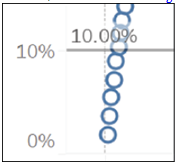
• Adding a third reference line at 10% tells us that it is our sixth-largest account that drives 10% of our sales, as can be seen in Figure 6.23:

Figure 6.23: Third reference line at 10%

Pareto charts– Dealing with Complex Visualizations, Customizations, and APIs-1

There is a rule in business (and sometimes in other areas of life) that states that 80% of consequences can be attributed to 20% of causes. It is called the Pareto rule and can be applied in a business context, too. For example, it is not uncommon for 80% of the revenues to be driven by only 20% of the accounts. Whether your business abides by this rule can be proven with a Pareto chart, which also allows you to identify the accounts driving your sales.
For this chart, we will be using the Account object joined with the Opportunity object in Salesforce, but you can also do it only with the Opportunity object.
We will start by selecting only the data we need and the opportunities that have turned into revenues. To do this:

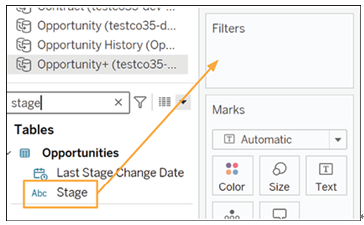
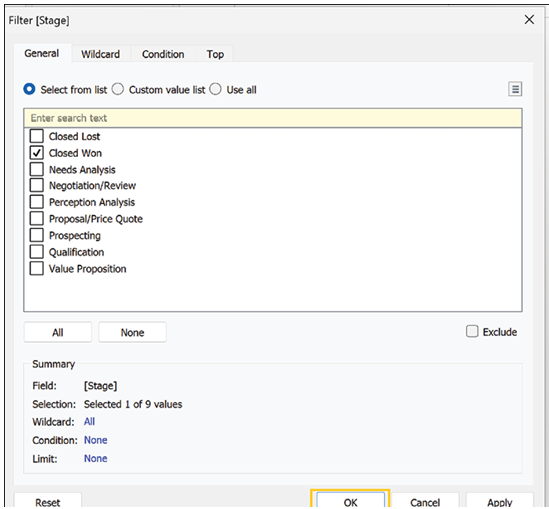
  1. Drag Stage into the Filters tab, as shown in Figure 6.1:

Figure 6.1: Add Stage filter for Closed Won

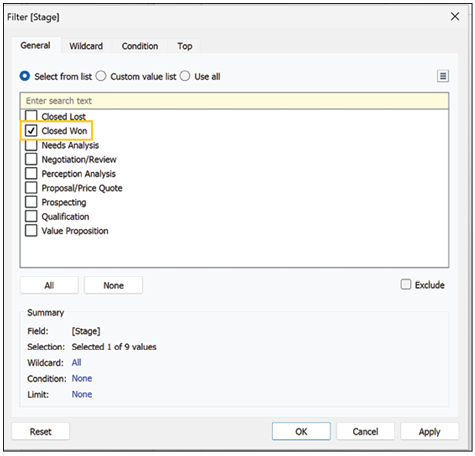
  1. Select Closed Won, as can be seen in Figure 6.2:

Figure 6.2: Stage filter set to Closed Won

  1. Click Ok.
    Now it is time to start creating the chart. The steps are as follows: 1. Drag Id from the Accounts object to columns, as shown in Figure 6.3:

Figure 6.3: Drag ID to Columns

  1. Drag Amount into the Rows, as can be seen in Figure 6.4:

Figure 6.4: Drag Amount to Rows

  1. Click on the caret on the ID pill and select Sort, as shown in Figure 6.5:

Figure 6.5: Sort the ID field

  1. A new menu will now appear. Follow the steps in the order below:
    a. On this menu, choose to sort by field.
    b. Select Descending.
    c. Select Amount from Field Name.
    d. Select Sum, if not already selected.
    e. Close the menu.
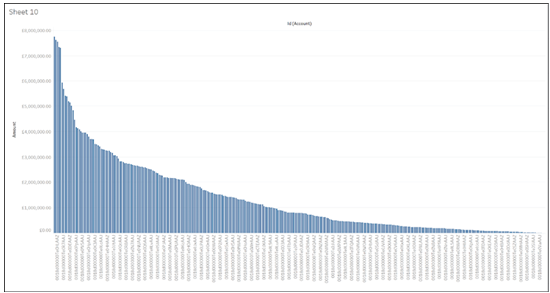
  2. Your chart should look similar to the one below:

Figure 6.6: Chart sorted by Amount descending

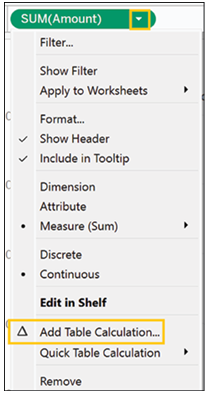
  1. Click on the caret on the SUM(Amount) pill and select Add Table Calculation.

Figure 6.7: Add Running Total table calculation
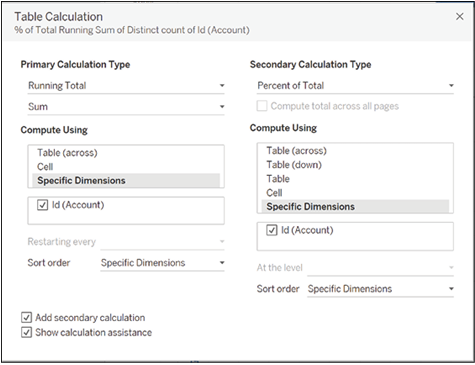
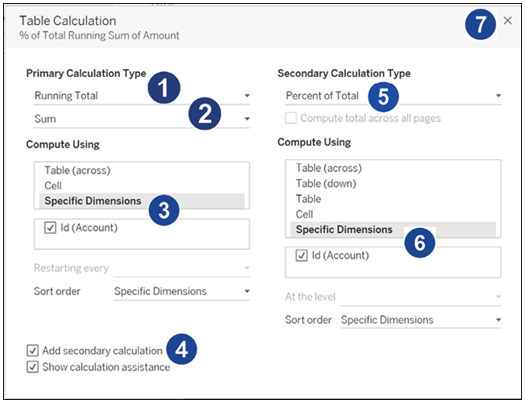
A new menu will appear (Figure 6.8), follow the steps in the order below:

  1. Select Running Total from the Primary Calculation Type.
  2. Select Sum, if not already selected.
  3. Select Specific Dimensions from the Compute Using menu; make sure Id is selected.
  4. Tick Add Secondary calculation.
  5. Select Percent of Total from the Secondary Calculation Type.
  6. Select Specific Dimensions from the Compute Using menu; make sure Id is selected.
  7. Close the menu.

Figure 6.8: Running Total and Percent of Total calculations added
Your chart should look much different, as shown in the following figure.

Figure 6.9: Cumulative chart
We will use a reference line to understand where 80% of our sales line is. To add a reference line, follow these steps:

  1. Click on the Analytics tab next to Data, as shown in Figure 6.10:

Figure 6.10: Click on Analytics tab

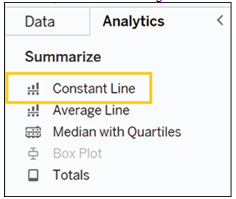
  1. Select Constant Line, as can be seen in Figure 6.11:

Figure 6.11: Select Constant Line

  1. Drag it to the Table menu which now hovers on your chart, as shown in Figure 6.12:

Figure 6.12: Drag Constant Line to chart

  1. Type 0.8 in the menu that opens, as seen below:

Figure 6.13: Set value to 0.8

Objectives– Dealing with Complex Visualizations, Customizations, and APIs

Introduction

In this chapter, we explore the untapped potential of Tableau in conjunction with Salesforce CRM data, diving deep into advanced visualizations to unlock richer insights. From a comprehensive look at advanced capabilities, including Sankey charts and calendar-based visualizations, to mastering customized geographical data visualizations, we will take you through the endless customization possibilities that Tableau offers. We will cap it off with a look at third-party integrations, examining how they can enrich your visualizations and optimize decision-making. This chapter aims to inspire you to push boundaries, fostering an innovative and data-curious culture within your organization. Let us embark on this exciting journey together to unravel the full extent of Tableau’s power and transform your CRM data into meaningful, actionable information.

Structure

The chapter covers the following topics:

  • Introducing the advanced capabilities of Tableau
  • Using extensions in Tableau

Objectives

Upon completing this chapter, readers will be able to understand the advanced capabilities of Tableau in visualizing CRM data by learning to create and interpret advanced charts such as Sankey diagrams and calendar visualizations and exploring ways to customize visualizations using geographical data. They will also discover how to utilize third-party integrations to augment data visualization capabilities and develop the necessary skills to uncover deeper insights and patterns from your CRM data. Finally, they will gain proficiency in transforming raw CRM data into meaningful, actionable visual insights and learn to use Tableau features and tools effectively to support data-driven decision-making processes.

Introducing advanced visualizations

At this point, we should feel quite comfortable with creating charts in Tableau, so we will now take it a bit further by looking at creating charts that require to make use of the full range of customization options in Tableau. We will use calculated fields and table calculations and finally bring together several datasets to showcase the possibilities of spatial analysis in Tableau’s maps.

Filled map– Extracting Deeper Insights with Funnels, Maps, and Hybrid Visualizations

To create a filled map:

  1. Double click on the Billing State/Province field.
  2. Drag Expected Revenue on the Colors mark.
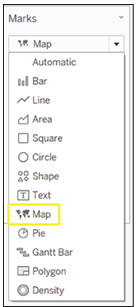
  3. Change the mark type to Maps, as shown in Figure 5.65.

Figure 5.65: Creating filled map

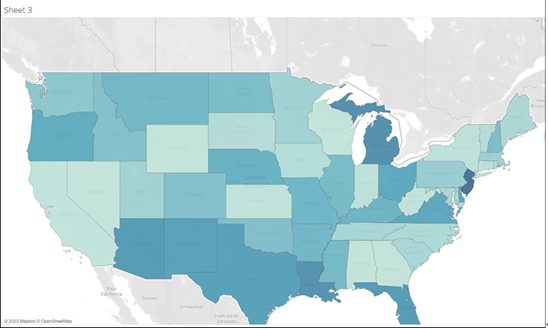
The result should look something like the map in Figure 5.66:

Figure 5.66: Final filled map visualization

We can use the tools mentioned above to zoom in and bring to the center of the view exactly the section of the map we want to show. From here we can see there is a distinct geographic pattern to the revenue we expect, with clusters of states that are close geographically and also present higher revenues.

Conclusion

In conclusion, this chapter has provided you with the knowledge and tools needed to create more advanced visualizations like donut charts, bar-in-bar charts, and maps. You’ve also learned how to harness the power of filters and calculated fields to customize and improve your data analysis. By following the steps outlined in this chapter, you can now dive deeper into your Salesforce data using Tableau, and more effectively communicate your insights to stakeholders.

Understanding geographical patterns, funnel analysis, and performance tracking are just a few of the many insights you can gain from the techniques discussed in this chapter. With this knowledge in hand, you can leverage the full potential of Tableau and Salesforce to make better-informed decisions for your organization. Keep experimenting with different visualizations and techniques as you continue to explore these powerful tools and uncover new insights into your data.

In the next chapter, we will move on to discussing advanced topics for visualization with Tableau.

Maps– Extracting Deeper Insights with Funnels, Maps, and Hybrid Visualizations

Maps are a convenient way of visualizing geographical information and unlocking insights that may be harder to grasp using other formats. Tableau supports maps out of the box and can showcase information up to zip code and street level. To create a map, follow these steps:

  1. The easiest way to create a map is to double-click on the geographical field of your choice. Geographical fields are indicated by a small globe next to their name, as shown in Figure 5.56:

Figure 5.56: Geographical fields marked with globe icon

  1. Any field can become a geographical field; the steps to follow have been described in Chapter 3.
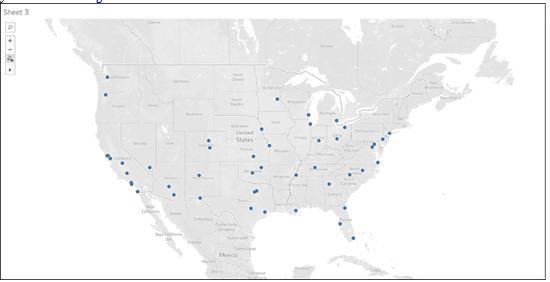
    In this case, the field of choice is Billing Zip Code; double clicking on it produces the map you can see in Figure 5.57:

Figure 5.57: Initial map created by double clicking geo field
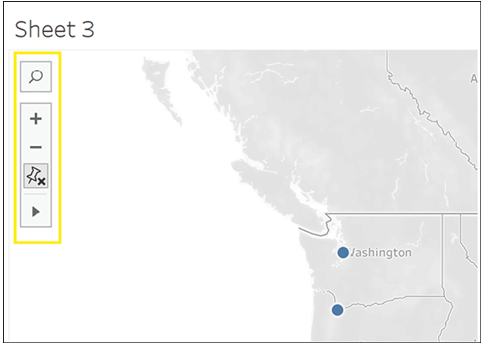
Before proceeding, you will notice a small set of icons on the top left corner of your map, as shown in Figure 5.58:

Figure 5.58: Map interaction tool icons
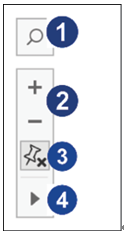
This menu, shown in Figure 5.59, lets you interact with the map and customize the user experience.

Figure 5.59: Additional map tools menu
Each icon has a function, as follows:

  1. Search: By clicking on this icon, you can type the name of a specific location you are looking for (that is, London or 09212).
  2. Zoom in and out: Clicking on the plus sign will zoom into the map, and clicking on the minus sign will zoom out.
  3. Reset button: Clicking on this button will remove any zoom in or out or any manual adjustments you may have performed on the map.
  4. Tool selection: Clicking on this icon will open a small sub-menu, from which you can select a variety of tools, as shown in Figure 5.60:

Figure 5.60: Map selection tool options
• Zoom area: Selecting this tool will change your cursor to a lens that you can use to zoom in on a specific part of the map.
• Pan: Selecting this tool will allow you to rearrange the map manually.
• Rectangular/Radial/Lasso Selection: Each tool allows you to select different points in the map according to your needs.
When sharing your map with your end users, you may want to give them access to all these tools or restrict the experience. You may prefer to restrict the tools available for users if you have set up your map to view only a portion. This may be the best display option if that is the area where your insights are concentrated. To do so, follow these steps:

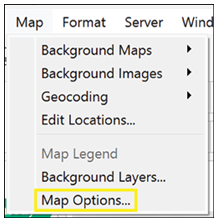
  1. Click on the Map menu at the top of your Tableau window, as shown in Figure 5.61.

Figure 5.61: Accessing Map menu

  1. Click on Map Options, as shown in Figure 5.62:

Figure 5.62: Opening Map Options dialog

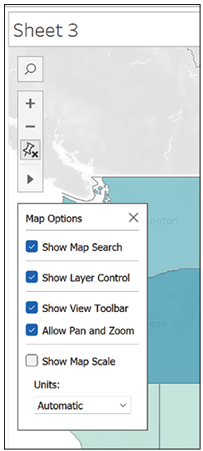
  1. A menu will open on top of the map, as shown in Figure 5.63:

Figure 5.63: Map options dialog

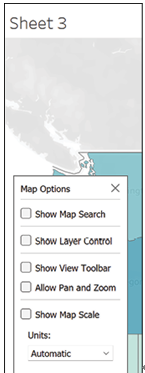
  1. Unticking an item will prevent the end user from accessing the tool. As you can see below, this time we do not let the end user customize its interaction with the map, and the map tools have, therefore, disappeared, as shown in Figure 5.64:

Figure 5.64: Limiting map tools available to user