You now have your chart with your reference line, but we can make it a bit clearer. Follow these steps:
- Right click on the Reference line you just created and click on Edit, as seen in Figure 6.14:
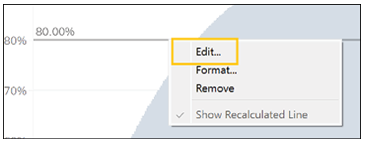
Figure 6.14: Right click the reference line
- In the window that opens, choose Custom from the Label menu, as can be seen below:
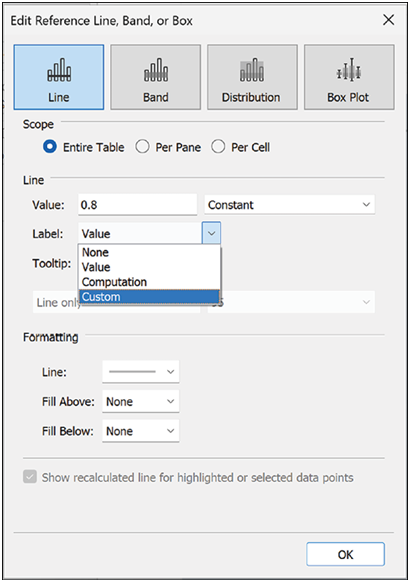
Figure 6.15: Set custom label
- Write something that helps users understand what the line represents, for example, “80% of all sales come from the accounts below this line”, as shown below:

Figure 6.16: Reference line label
- Click on OK.
We can see that the 80/20 rule does not apply to our case (Figure 6.17), but we cannot yet see clearly where that line is; it seems to be somewhere between 30 and 40%, but is that the case? We can find out exactly and, at the same time, improve our Tableau skills.
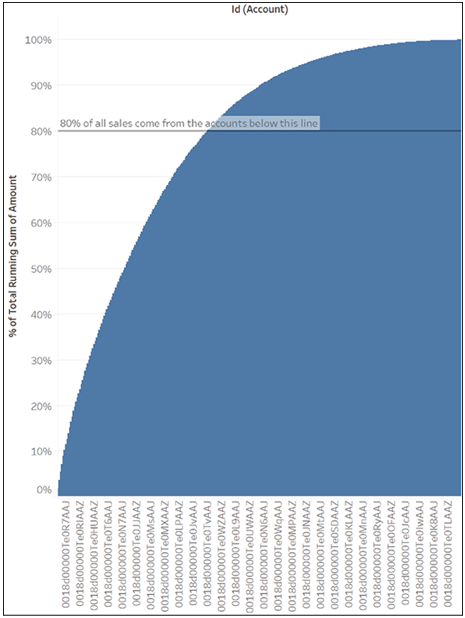
Figure 6.17: Copy Id field
For this next stage, press CTRL on your keyboard and drag the ID field from Columns to the Detail mark, as seen in Figure 6.18. This should copy not only the field but also the sorting we set up earlier.
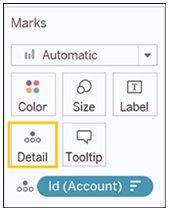
Figure 6.18: Id field copied
From here, follow these steps:
- Click on the caret on the Id pill, hover on Measure, then select Count (distinct), as seen in Figure 6.19:
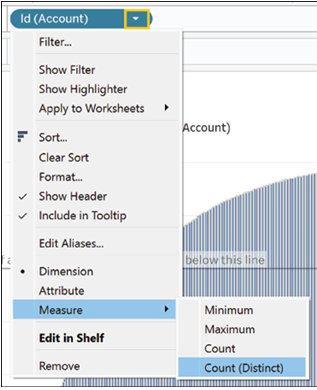
Figure 6.19: Change Id measure to Count (distinct)
- Do not panic if your chart looks broken now; we are about to fix it. Click on the now green ID pill and apply the same table calculation we applied on the SUM (Amount) pill, with the same options, as shown below:
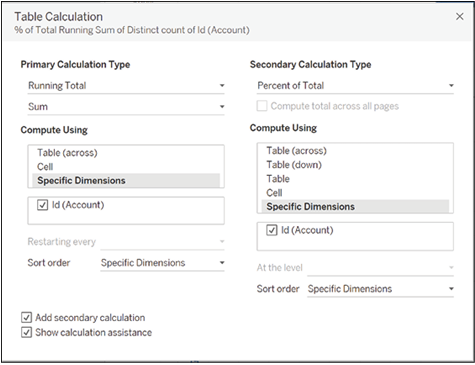
Figure 6.20: Apply table calculations to copied Id field
- You now have a Pareto chart, which tells you that 37% of your accounts drive 80% of your revenues (Figure 6.21).

Figure 6.21: First reference line at 80%
Some other insights are:
• Adding a second reference line at 50% tells us that it is 17% of our accounts that drive half of our sales, as shown in Figure 6.22:

Figure 6.22: Second reference line at 50%
• Adding a third reference line at 10% tells us that it is our sixth-largest account that drives 10% of our sales, as can be seen in Figure 6.23:
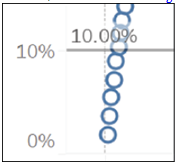
Figure 6.23: Third reference line at 10%