We will again use donut charts to look at the ratio of lost to won opportunities per lead source. To do so, we will have to perform two operations:
• Filter the stage so that it only shows opportunities that have been either Lost or Won.
• Create a new field that labels each opportunity as lost, won, or still open.
From a new sheet, the steps to perform are as follows:
- Drag Stage to the Filters card. A menu will open, as shown in Figure 5.30:
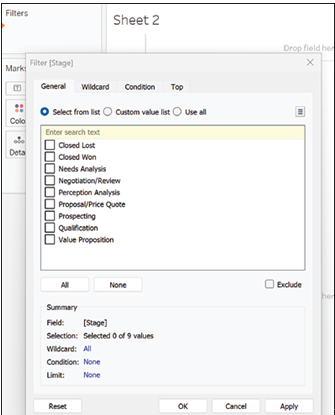
Figure 5.30: Adding Stage filter
- Select Closed Lost and Closed Won from the available list and press OK, as shown in Figure 5.31:
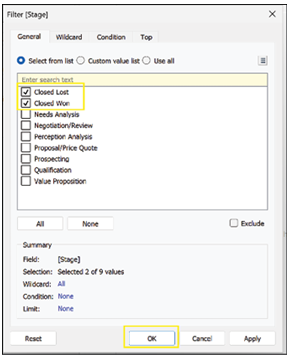
Figure 5.31: Selecting specific Stage values to filter
- There are several ways to create a calculated field in Tableau. The two most popular ones are the following: 1. Click on the caret next to the search function on top of your dimension list, then select Create Calculated Field, as shown in Figure 5.32:
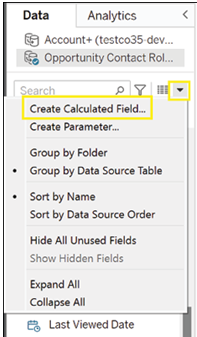
Figure 5.32: Accessing Create Calculated Field option
- From the Analysis menu at the top of your sheet, click on Create Calculated Field , as shown in Figure 5.33:
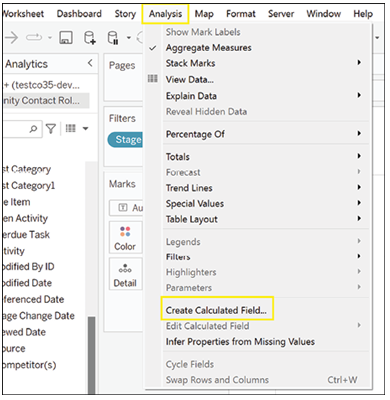
Figure 5.33: Accessing Create Calculated Field via Analysis menu
- The calculated field window will now open. In this window, you can find five things, as shown in Figure 5.34:
- Calculation title: This is where you can type the name you will give to the new field you are creating.
- Calculation area: This is where you will write the logic that determines the output of the field you are creating.
- Function list: This is the list of ready-made functions available to use, which are not too dissimilar from what you can find in Excel or SQL. When you select a function, Tableau shows you what it does and gives you an example of how to use it.
- Apply button: Clicking this button will create your calculated field or modify your calculated field but will not close the window. It is useful if you are trying different calculations until you set on the final one.
- OK button: Clicking this button will create your calculated field or modify your calculated field, then close the window. It is useful if you are satisfied with the calculation.
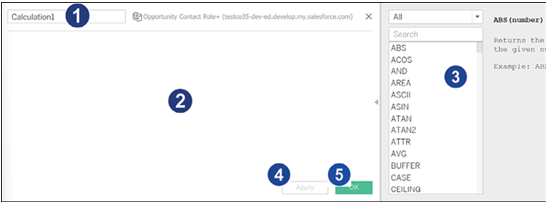
Figure 5.34: Calculated Field window overview
- Since we want to create a new field based on Stage, we will use an IF function. The formula is as follows:
IF [Stage] = ‘Closed Lost’ THEN ‘Lost’
ELSEIF [Stage] = ‘Closed Won’ THEN ‘Won’
ELSE ’Still Open’
END
- As a title, we will write Lost, Won or Open, then press OK, as shown in Figure 5.35:
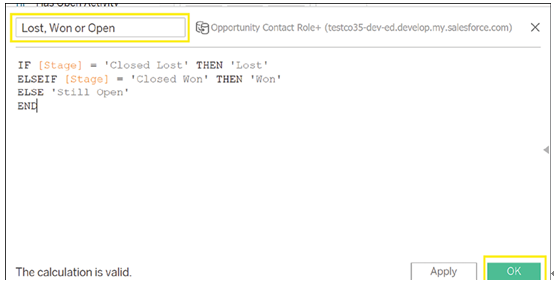
Figure 5.35: Creating Lost, Won or Open calculated field
Calculated fields are automatically added to the list of fields and can be distinguished by the little equal sign that precedes their data type, as shown in Figure 5.36:
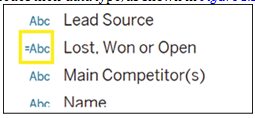
Figure 5.36: New calculated field added to dimensions list
You can always change a calculated field in Tableau, just by right clicking on the name and selecting Edit from the menu that opens, as shown in Figure 5.37:
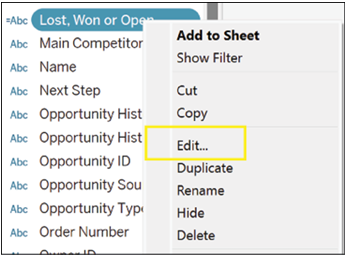
Figure 5.37: Editing a calculated field
- Now that you have filtered your Opportunities and created a new calculated field, follow the steps in the previous section to create a new donut chart. The final result should look something like Figure 5.38:
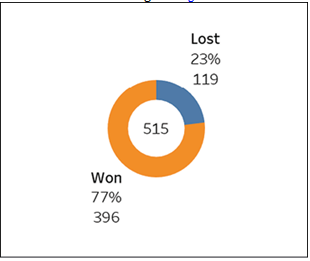
Figure 5.38: Final donut chart with calculated field
- To compare the share of lost and won opportunities by lead source so we will drag Lead Source to Columns, as shown in Figure 5.39:

Figure 5.39: Adding Lead Source to Columns shelf
- Tableau has created a series of donut charts, one for each lead source, as shown in Figure 5.40:

Figure 5.40: Donut charts showing breakdown by Lead Source
- We can see that some lead sources provide opportunities that are more likely to close, but our calculation does not show the share of lost and won opportunities per lead source.
To change it, click on the field used for the share calculation. It has a triangle next to its name, as shown in Figure 5.41.
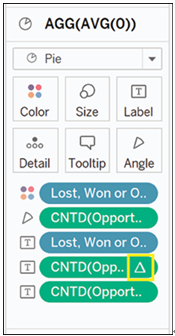
Figure 5.41: Selecting share calculation pill
- From the menu that opens, click on Edit Table Calculation, as shown in Figure 5.42:
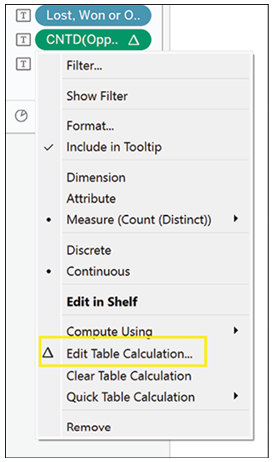
Figure 5.42: Accessing Edit Table Calculation
- From the menu that opens, click on Cell, then click on the x in the top right corner to close the menu, as shown in Figure 5.43:
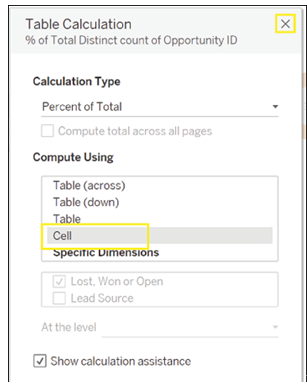
Figure 5.43: Changing table calculation to Cell level
Your calculation should now be correct, as shown in Figure 5.44:
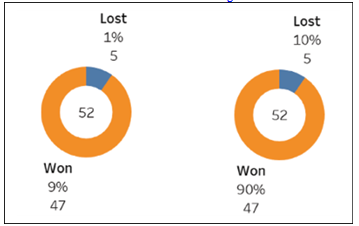
Figure 5.44: Correct donut chart calculations