As we proceed with our campaign analysis, we may want to understand specifically which campaigns ran over budget. In cases like this, a table may provide some useful insights. To create a table:
- Select Name from the list of dimensions and drag it onto Rows as shown in Figure 4.15:
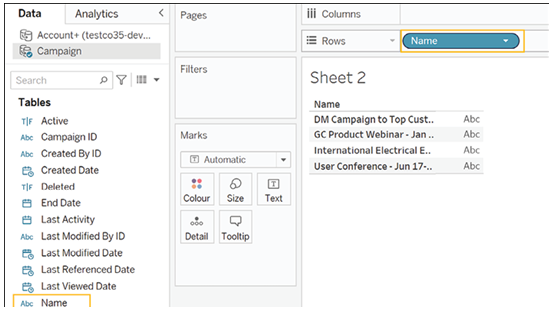
Figure 4.15: Dragging the ‘Name’ dimension from the list.
- Select Actual Cost in Campaign and drag it onto Text in the Marks area as shown in Figure 4.16:
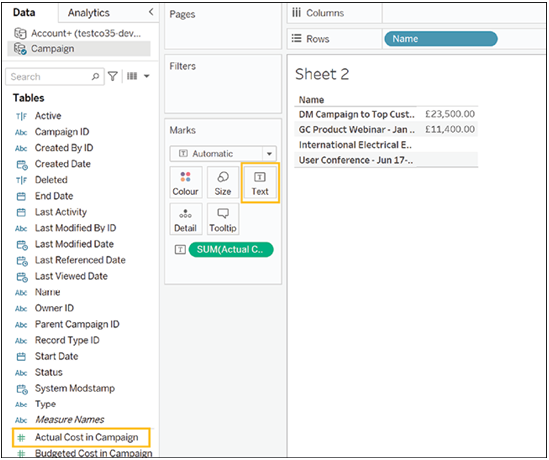
Figure 4.16: Adding Actual Cost to Text in the Marks area
- Select Budgeted Cost in Campaign and drop it onto the table’s numbers. The cursor will change and say Show Me as shown in Figure 4.17:
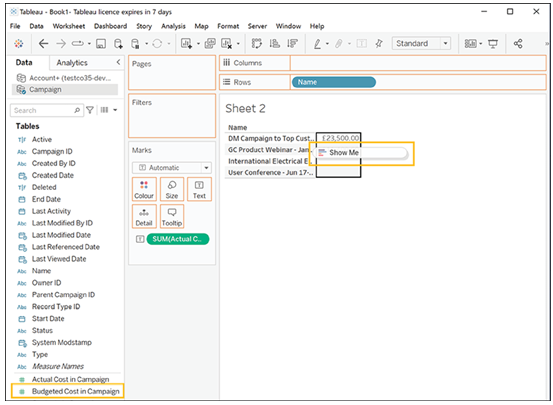
Figure 4.17: Selecting Budgeted Cost in Campaign and using “Show Me”
- Once you drop the field, your table should look as shown in Figure 4.18:
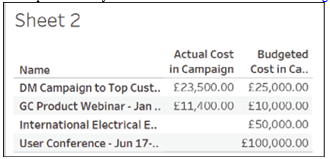
Figure 4.18: Clean and clutter-free
We can now see that it was only one of our campaigns that ran over budget. We can also see that for some campaigns, we only have budgeted costs and no actual costs. We will therefore filter them out. The quickest way to filter out a single entry is to right-click on the name you wish to filter out and select Exclude from the menu that opens up as shown in Figure 4.19:
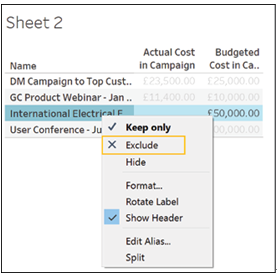
Figure 4.19: Filtering out campaigns with budgeted costs only
You can also press CTRL and select multiple elements, then right-click on any of them and choose Exclude from the menu that opens up. This is what our campaign details looks like after filtering out the campaigns for which we have no actual expenditure amount as shown in Figure 4.20:
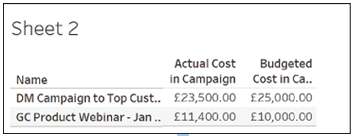
Figure 4.20: Filtered campaigns without actual expenditure amount