It is not possible to union data using the Salesforce connector, so the steps below will only be available if you are connecting to your Salesforce data via a database connection as shown in the section Connecting to your Salesforce data in SQL.
A union works differently from the methods shown above in that, rather than adding columns from different data sources, it adds rows to existing data. In order for unions to work, all data objects must have the same structure.
The steps to perform in this case are the following:
- Connect to the database as shown in the section Connecting to your Salesforce data in SQL.
- Drag the New Union button to the main data area, as shown in Figure 3.34:

Figure 3.34: Adding a new union in Tableau
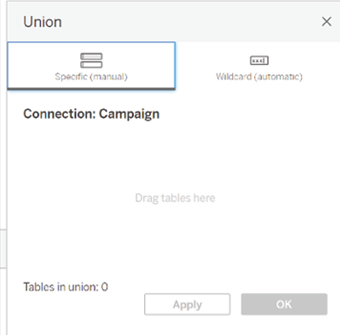
- A menu will open, as shown in Figure 3.35:

Figure 3.35: Creating union
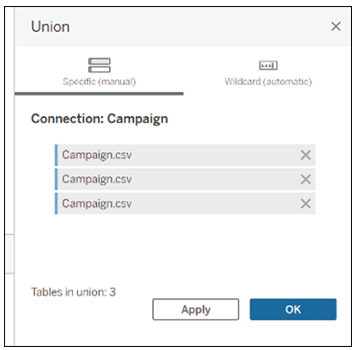
- Drag here all the objects to be unioned. Tableau will read the structure of the first object and expect all objects to follow the same structure, as shown in Figure 3.36:

Figure 3.36: Selecting data sources to union in Tableau
- If Tableau encounters no problem in unioning the data, you will see the final dataset at the bottom of your screen.
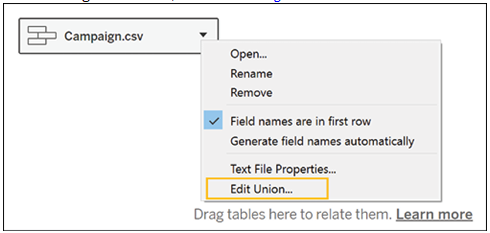
- You can always add or remove objects by clicking on the caret on your union and clicking Edit Union, as shown in Figure 3.37:

Figure 3.37: Final unioned dataset shown in Tableau
- The same menu will open. From this same menu you can specify whether the field names are in the first row of your data or whether Tableau should generate field names automatically. The option to choose will depend on how your data is structured.
In this chapter, we have explored various methods for connecting to data in Tableau and delved into the software’s data cleaning and transformation capabilities. You have learned how to connect to Salesforce data using the Salesforce Connector and how to authenticate and configure the connection successfully.
We also discussed connecting to data that has been exported to an SQL database and highlighted scenarios where this method may be beneficial. Furthermore, we have equipped you with the skills to manipulate data in Tableau using techniques such as pivot, join, and split once the data is loaded into the software.
In addition, we have covered managing data sources in Tableau, including connecting to multiple data sources, creating data source filters, and crafting calculated fields. With the knowledge and skills gained from this chapter, you are better prepared to effectively connect to, clean, and transform data in Tableau for enhanced data analysis and visualization. This will ultimately enable you to make more informed decisions and drive impactful insights from your data.
In the next chapter, we will delve into the core functionality that makes Tableau such a powerful visualization tool.
1 Disclaimer: You may not be able to see the color of the ticks change if you have brought a paperback version of the book. However, you can access the colored version of the image at the link given at the beginning of the book.