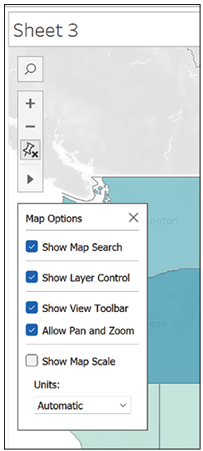
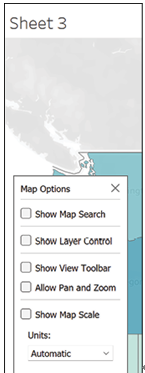
It is also possible to use third party services to create visualizations in Tableau. Tableau Exchange (https://exchange.tableau.com/extensions) provides an array of objects that can be used in a Tableau dashboard to create charts but also perform spatial analysis, add custom annotations to charts, and even collaborate in Teams.
Salesforce has its own set of extensions, and there is also a set of extensions developed directly by Tableau.
To access them, follow the below-mentioned steps:
- Create a new dashboard by pressing the New Dashboard button at the bottom of your screen, as seen in Figure 6.71:

2. Next, drag the Extension object on your dashboard.
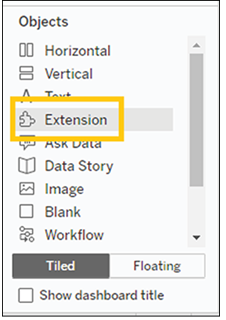
Figure 6.72: Add Extension
3. The interface which opens will show all the Extensions available on Tableau Exchange without needing to leave Tableau.
Each extension has its own set of instructions, and in Chapter 9 – Exploring Einstein AI and Advanced Analytics, we will show you how to use the Salesforce Einstein extension, but in the meantime, explore the available range to find the extension that mostly fits your needs. And if you cannot find the perfect one, you are now well-equipped to create every sort of visualization in Tableau.
In conclusion, as we wrap up this insightful journey into the realm of advanced visualizations using Tableau and Salesforce CRM data, it is our hope that you have gained a deeper understanding of the vast capabilities that this visualization tool offers. The power to transform raw, often complex CRM data into meaningful and insightful visual representations lies at your fingertips.
Through this chapter, we aimed to elevate your skills from creating sophisticated Sankey diagrams and calendar-based visualizations to expertly customizing geographical data visualizations. We also discussed the power of third-party integrations, a crucial aspect in today’s interconnected technological landscape. The potential for innovation here is vast, and we encourage you to explore further, continually pushing boundaries to uncover deeper insights from your CRM data.
Remember, fostering a data-curious culture within your organization is a journey, not a destination. Every dataset brings new questions, unique insights, and innovative perspectives. The beauty of data visualization is that it brings us closer to the story hidden within the data, enabling data-driven decision-making crucial for business growth.
We will now move back into Salesforce to look at using Tableau Visualizations within the CRM.
Join our book’s Discord space
Join the book’s Discord Workspace for Latest updates, Offers, Tech happenings around the world, New Release and Sessions with the Authors:
